A recap of the saga (and a confession about the name)
In previous articles we told the story of how we moved from a single VM with Docker Compose to a Kubernetes cluster on Talos OS, and how we handle backups on Kubernetes by preserving the declarative state instead of dragging along monolithic VMs hundreds of GB in size.
In that article on backups I mentioned a tool we had to write ourselves because no solution, neither commercial nor open source, did exactly what we needed with the operational simplicity we demanded. That tool, internally, has a name — KDR — and I'll admit right away that it's a placeholder name we've been carrying around for months and that we still haven't found the courage to change. It works so well that the official christening keeps slipping from sprint to sprint.
The interesting thing is that KDR was born for backups, but in the meantime it has grown. It's become the tool we use to look at the cluster, not just the one we use to keep it safe. This article tells the story of how and why.
The missing piece: developer logs
When we migrated develop and staging to Kubernetes, we gained a lot of things — parity with production, autoscaling, the end of ghost containers. But we also discovered a gap we hadn't felt with Docker Compose on a VM: the developer no longer had a simple way to read the logs of their own software once it was running in develop or staging.
On the old VM, after all, you just had to log in and run a docker logs. On a cluster the story is different: pods sit on different nodes, they get recreated, they get scheduled elsewhere, and to read a log you have to know kubectl, know which namespace to look in, know what the right pod is called at that precise instant. Translated into practice: the developer would open a message to me or to whoever ran DevOps and ask “can you send me the staging logs for X?”. Multiplied by ten people and by the dozens of times a day you need to look at a log while working on a feature, it's an absurd bottleneck. And a DevOps acting as a log photocopier is a DevOps wasted.
Grafana and Prometheus: great engines, an engineer's cockpit
The first answer was the obvious one, the one everyone reaches for: Grafana and Prometheus. We installed them, configured them, wired them up. And under the hood they work great — Prometheus as a metrics engine is a de facto standard for good reasons, and we have no intention of throwing it out.
The problem isn't the engine. The problem is the cockpit.
Grafana is a tool designed by programmers for programmers. It's extremely powerful, but its UI/UX assumes you already know what you're looking for, what the metrics are called, how to write a PromQL query and how to build a dashboard. For those who live in it every day it's wonderful. For a frontend developer who just wants to understand why their service in staging is returning a 500, it's a wall. You end up explaining to people how to use the observability tool instead of just letting them observe.
And here's where the question it all started from kicks in.
The right questions (not just the logs)
Instead of accepting “Grafana is complicated, deal with it”, I asked myself two things:
- What can I do to give everyone the logs they need, without going through me?
- What other problems do developers and DevOps — myself included — have with Grafana and, more generally, with Kubernetes?
The second question is the one that turned a small project into something more ambitious. Because the truth is that the pain wasn't just “the logs”. It was that the cluster is opaque. To understand the state of a namespace, how many resources it has, how the ingresses are configured, which pod is eating memory and which one is in CrashLoopBackOff, you have to put together three or four different tools and quite a few commands memorized by heart. Even for us, who wrestle with kubectl every day, it's friction.
From these two questions KDR extended from being a backup tool to being our cluster observability tool.
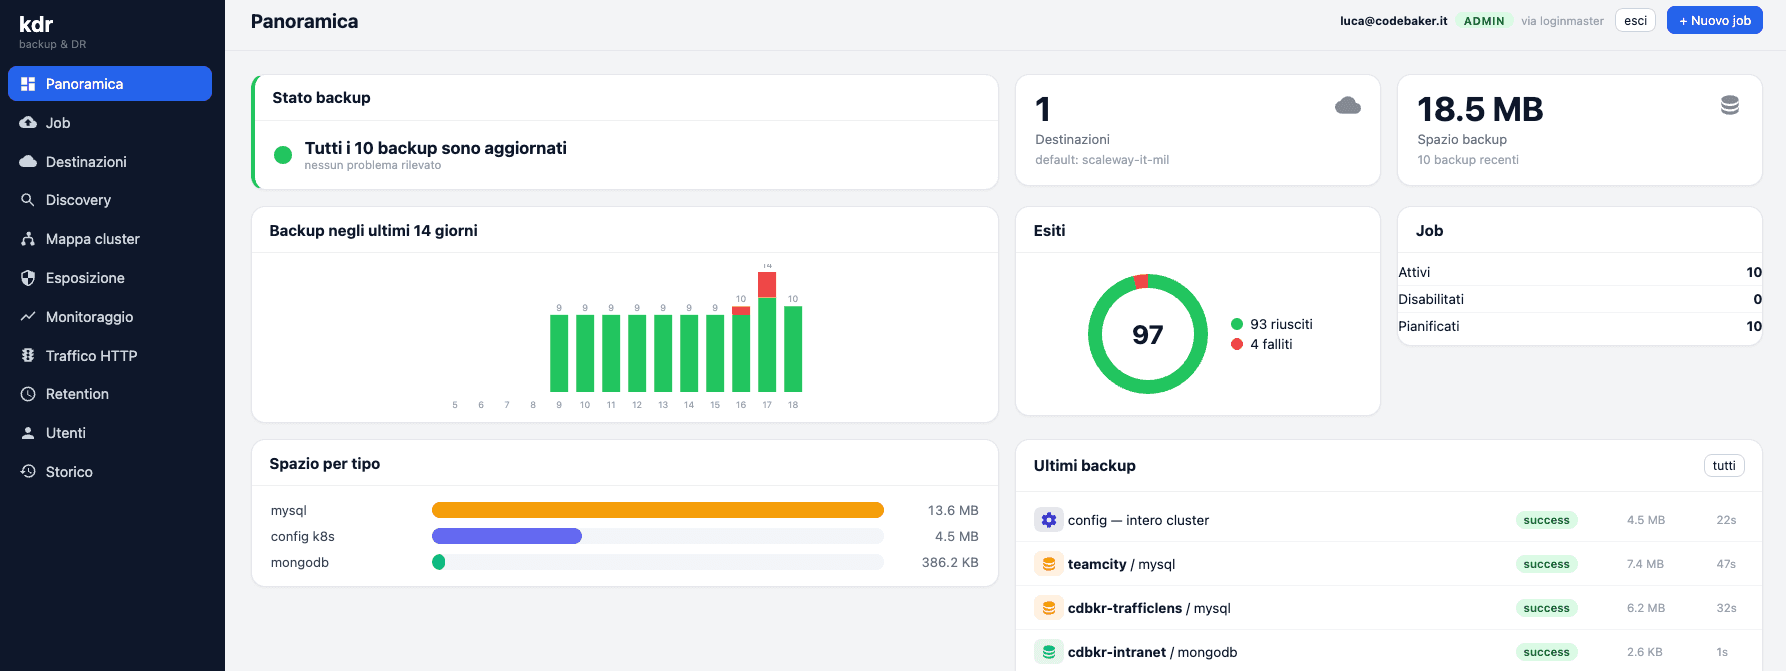
What KDR does today
The design is the same compass we use for every in-house tool: simple, clean, effective. No dashboards to configure, no PromQL to learn. You open it, and you see.
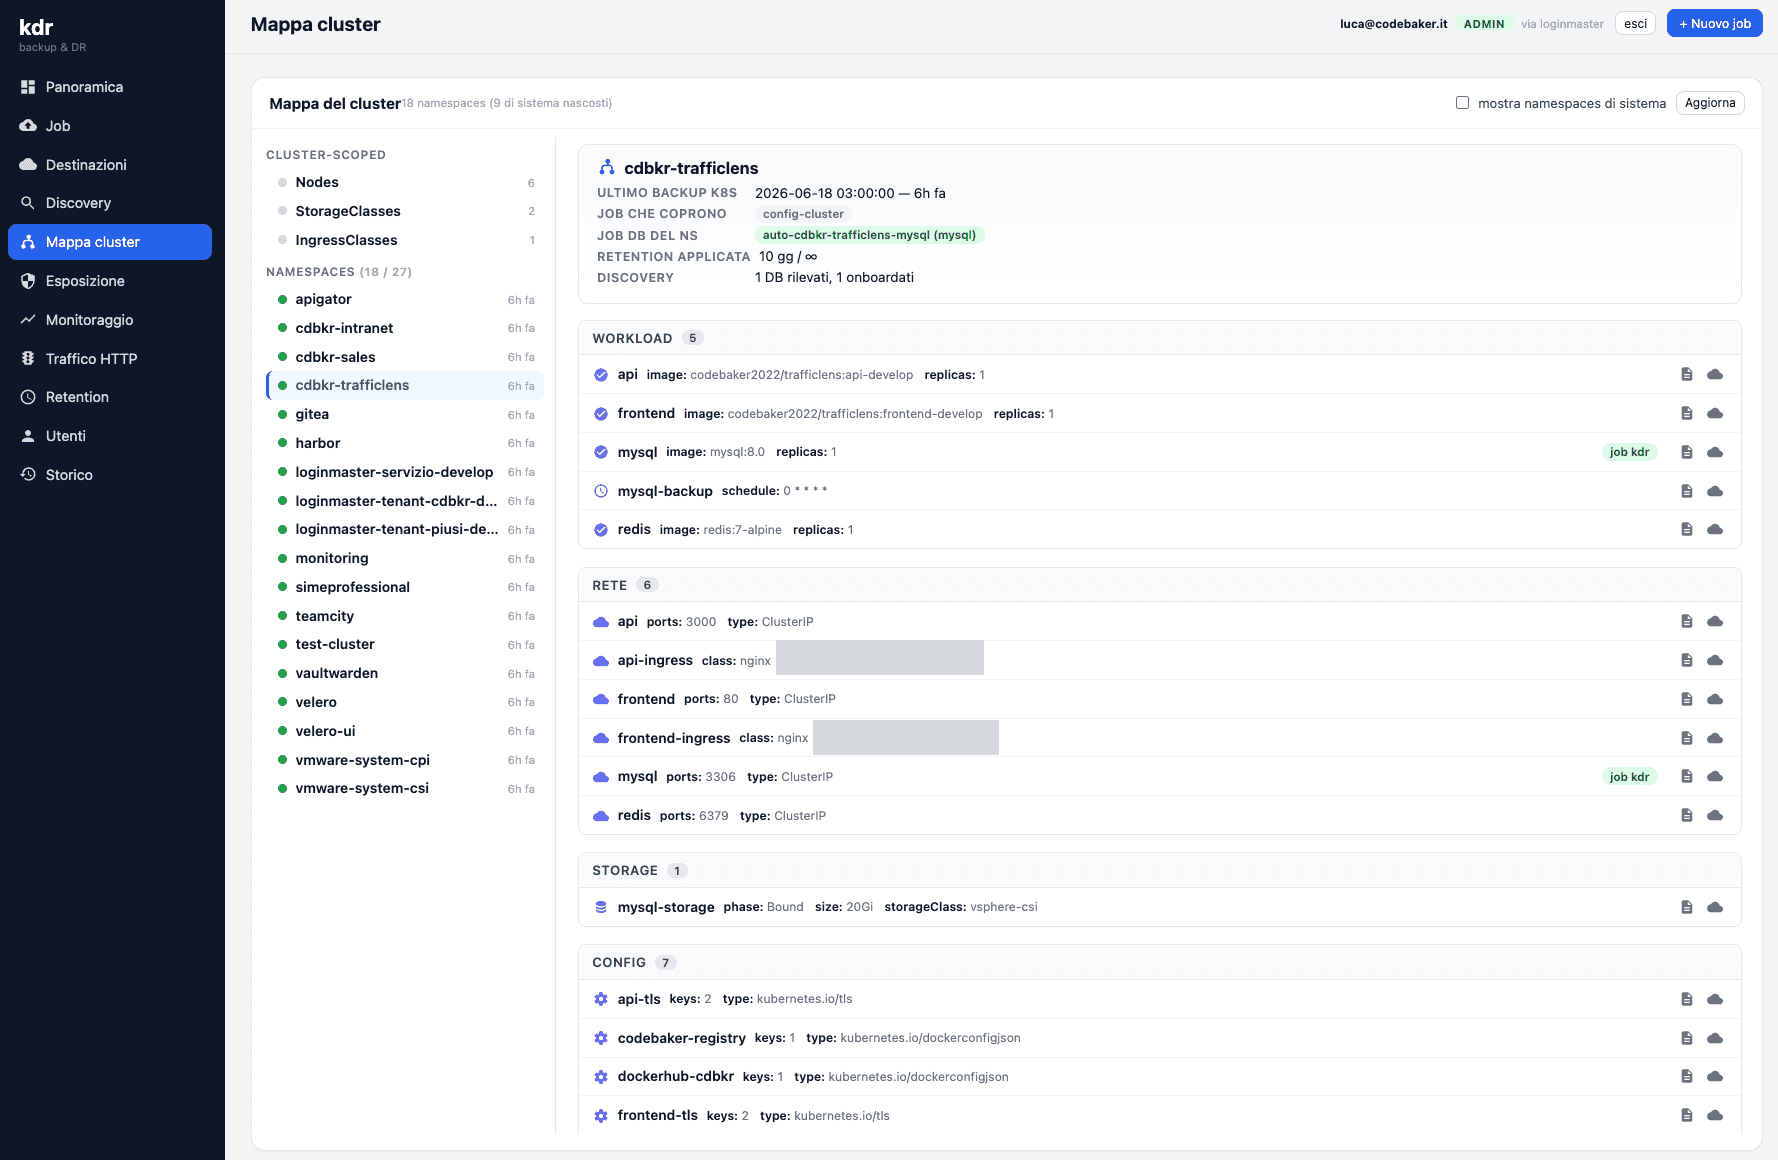
- It represents the cluster structure graphically. KDR draws the cluster for what it is: a hierarchy. You start from the overview and drill down — cluster → namespace → resource type → single pod — without needing to know in advance what to look for. It's a map, not a terminal.
- It monitors every piece, from the cluster to the single pod. State, health, restarts, consumption: at every level you see whether things are running as they should. A pod in error is spotted immediately, without having to know it exists.
- It splits resources by type and by namespace. Deployments, Services, Ingresses, ConfigMaps, Secrets, PVCs grouped in a readable way, namespace by namespace. It's the difference between “I have a list of 400 objects” and “I have a tidy room where I know where to look”.
- It makes Prometheus metrics readable. KDR intercepts the metrics Prometheus already collects and presents them in an understandable way, without asking the user to write a query. The engine stays Prometheus; on top of it we've put a cockpit designed for human beings.
- It shows ingress controllers and configurations at a glance. Understanding how traffic is routed and how each single component is configured — without playing the archaeologist between
kubectl getandkubectl describe— was one of the most underrated pains. KDR puts it right in front of you.
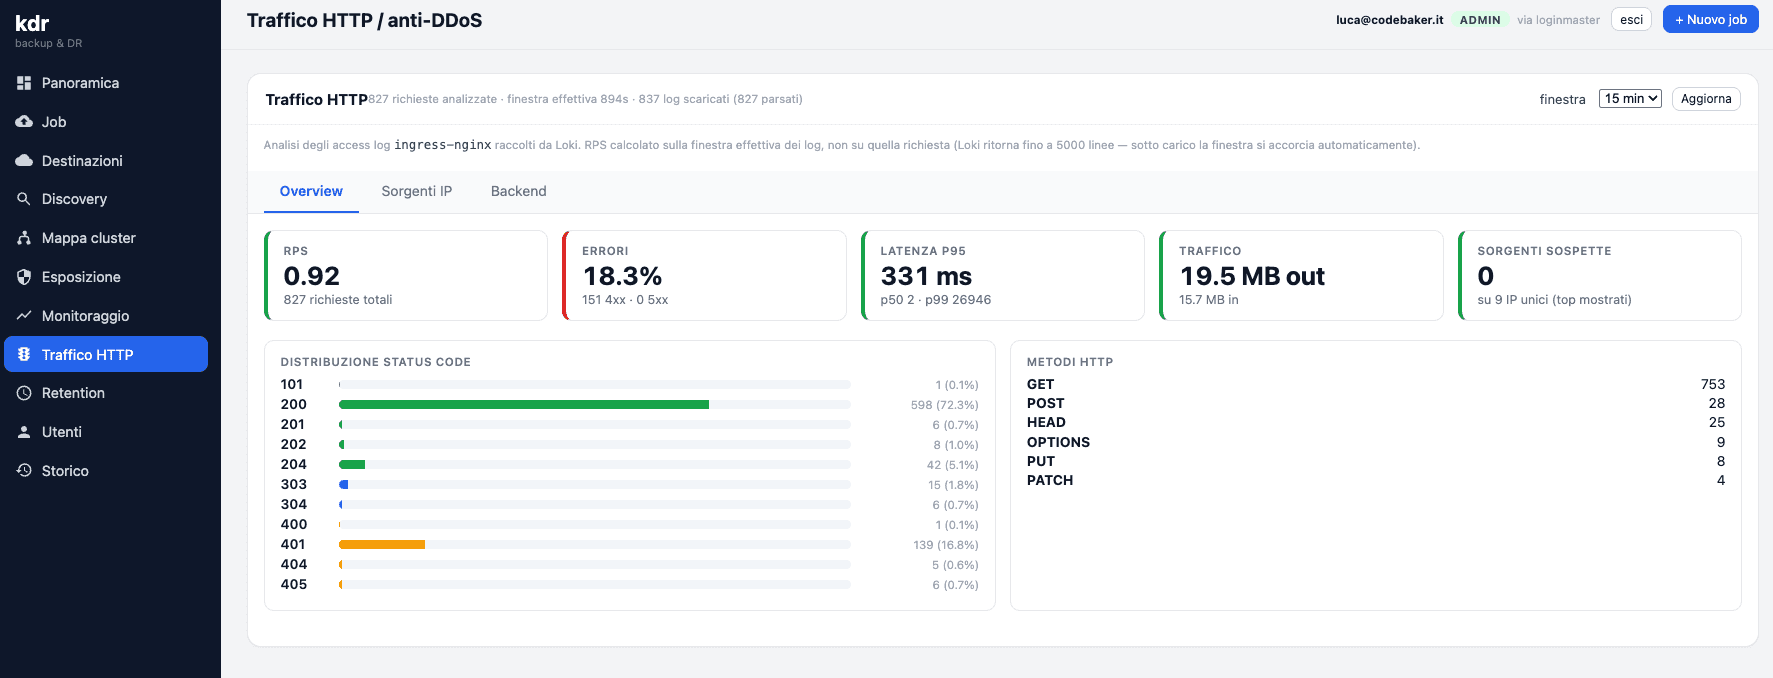
The common thread is just one: lowering the barrier between those who need to understand what the cluster is doing and the cluster itself. Not because Kubernetes should be hidden, but because most of the people who work on top of it shouldn't have to become Kubernetes experts to do their job.
Logs, finally self-service
And now we come to the reason it all started. Inside KDR every developer has their own access to analyze the logs of the services in develop and staging. On their own.
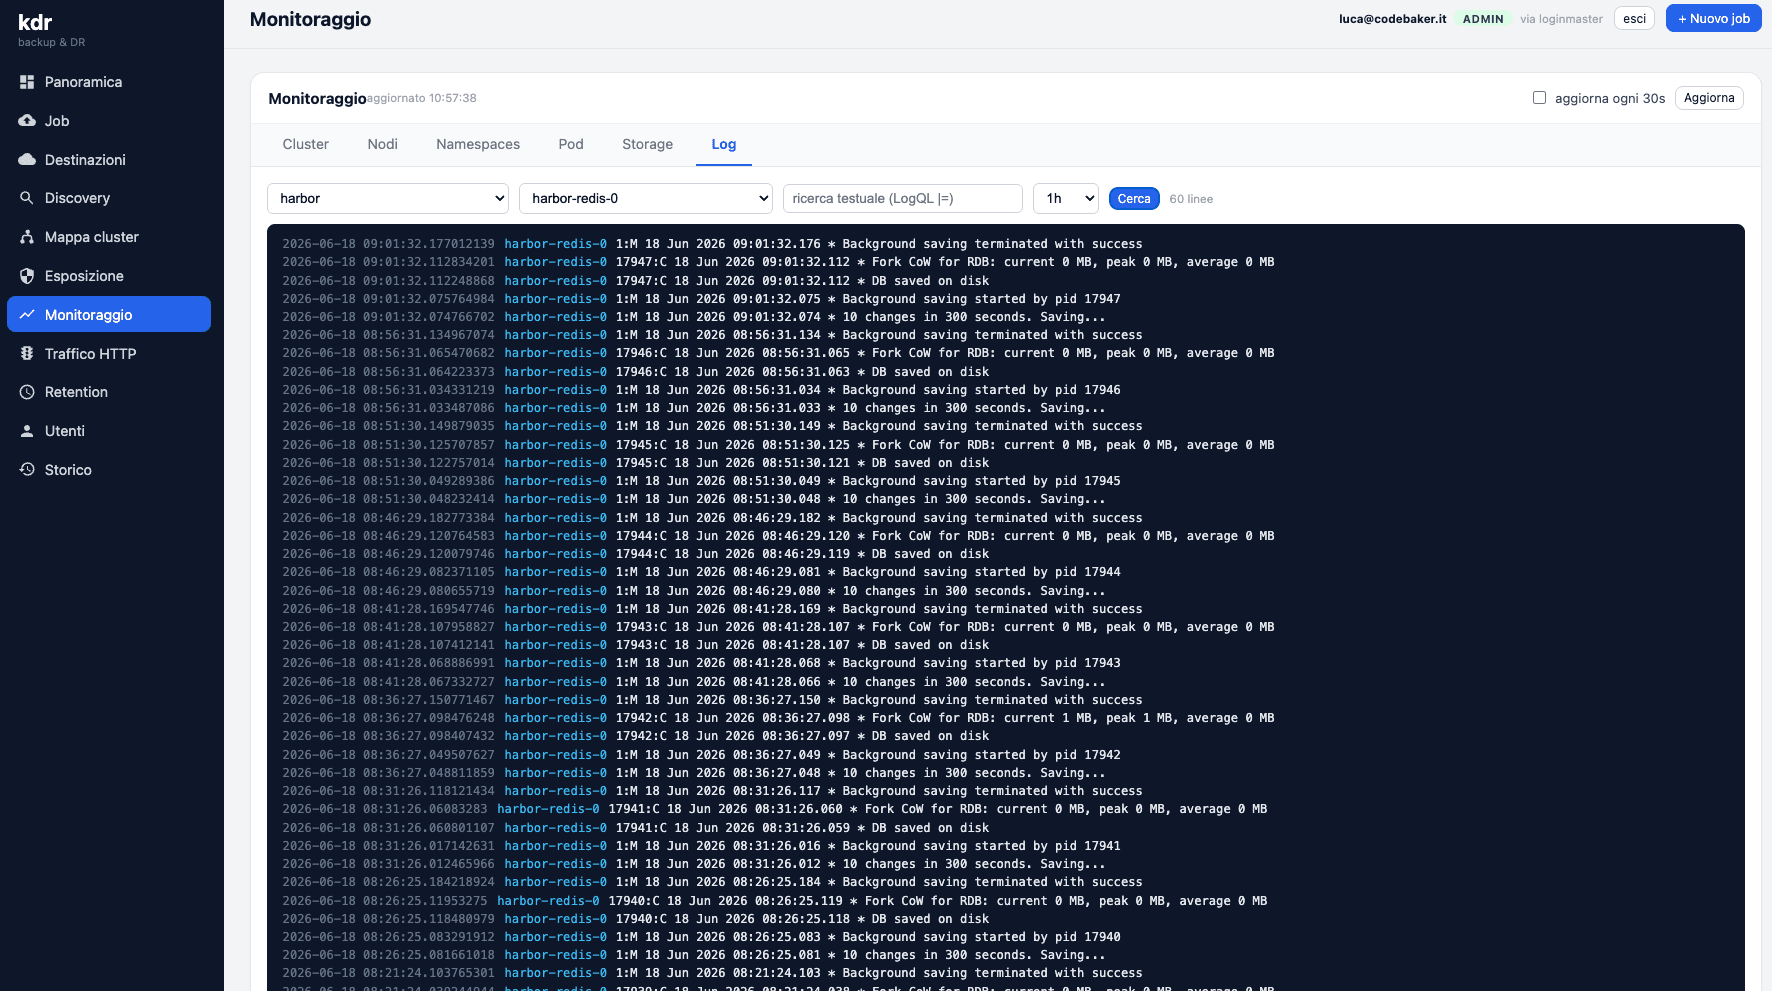
kubectlNo more “can you send me the logs?”. No more DevOps acting as an intermediary between the developer and their own software. The developer opens KDR, finds the service, reads the logs, figures out what happened and goes back to work — all without a kubectl and without bothering anyone.
It seems like a small thing, but it changes the team dynamic in two ways. First: whoever writes the code reclaims the autonomy to debug it, which is exactly where the responsibility should sit. Second: the IT department and DevOps stop being a log-delivery service and go back to doing the things they're actually there for. Everyone happier, me included.
Building instead of buying (again)
In the article on backups I closed with a piece of advice: look for tools that do what you need, and if you can't find them, write them. KDR is the living proof of that philosophy growing over time. It was born to solve one problem (backups), and precisely because we wrote it in-house, when an adjacent problem emerged (observability) extending it cost infinitely less than adopting, integrating and maintaining yet another third-party product.
It's not a crusade against open source or against commercial software — we use Prometheus and we hold onto it tightly. It's a matter of where to draw the line: we take the engine where it already exists and is excellent, and we build the experience ourselves, tailored to how our team actually works. And we do it while staying on European technologies and infrastructure, because data sovereignty, for us, isn't a slogan to slap at the bottom of a slide.
Takeaways
Four things, if you too have a cluster and a team that has to work on top of it without everyone turning into DevOps:
- 1
Observability isn't “I installed Grafana”. The engine is half the work. The other half is making it usable by those who don't live inside queries. A UI designed for engineers excludes everyone else.
- 2
Give developers self-service access to their own logs. A DevOps acting as a log photocopier is a bottleneck and a waste. Debug autonomy goes where the code is.
- 3
Make the cluster readable, not just queryable. A map that drills down from cluster to pod, with resources grouped by namespace and type, is worth more than a thousand
kubectlcommands memorized by heart. - 4
A good in-house tool grows with you. KDR was born for backups and became observability. When the tool is yours, extending it is natural; when it's someone else's, every new need is a negotiation.
And yes, sooner or later we'll give it a serious name too.
Luca Vitali
Want to make your Kubernetes cluster readable?
Codebaker designs and manages Kubernetes infrastructure on European cloud (Scaleway) and on-premise (vSphere + Talos OS), with tailor-made observability, backup and disaster recovery. If your cluster is a black box and you want to change things, let's talk.
Contact us